
Burndown without escapes: why you need to know the most infested area before spraying
Pre-plant burndown is for the whole field. What has to be decided with data is the product and the rate, and that is set by the most infested part, not by the average. See how a flight with an ordinary drone shows where it is.
In pre-plant burndown, the maths is usually done the simplest way: field area times a rate, chosen from a general impression of how the field looks. The problem is that weeds do not come up evenly. Almost every field has stretches that are overrun, with large, dense plants, and stretches where they are few and small.
When the rate is planned for the "average" situation, it falls short exactly where infestation is worst. And that is where control fails. This article makes a simple case: burndown is for the whole field, and the rate is decided by the most infested area. To do that, you need to know where that area is and how big it is.
First of all: burndown is for the whole field
It is tempting to look at an almost clean stretch and conclude that it does not need spraying. In pre-plant burndown that conclusion is dangerous, and it is important to say why.
An escape may be irreversible. Once the crop has emerged, the list of selective herbicides that can be used over it is short, and they tend to be less effective than the options available before planting. A weed that survived burndown will compete with the crop from day one, and there may be no tool left to remove it.
Few weeds is not no weeds. An area with low cover on the day of the flight has small plants, seedlings the image does not show and a seed bank in the soil. Leaving it uncontrolled means sowing next season's problem.
Resistance and large plants make everything worse. Researchers at Embrapa Soja, in Brazil, report that many growers leave burndown until close to seeding, when horseweed and sourgrass are already well developed, which is one of the causes of loss of herbicide efficacy, and that even glyphosate-susceptible plants should be controlled while still small. The same work describes crops being harvested amid a heavy presence of those two species, and links the use of reduced rates to a growing seed bank (Gazziero; Adegas; Voll, 2013).
The damage from an escape is out of proportion. The cost of an adequate rate is small next to the yield loss caused by an infestation that escaped, which in extreme cases can make mechanical harvest unfeasible.
So there is no exempt area. What can and should vary within the field is the product and, above all, the rate.
The mistake of setting the rate by the average
That weeds are distributed in patches is one of the best documented facts in weed science (Hamouz et al., 2013). Seeds fall close to the mother plant, machines drag propagules in the same direction every time, and differences in soil, moisture and management history favour infestation in some spots and not in others. Density and distribution vary from species to species and from field to field (San Martín et al., 2016).
There is a line of research, carried out in cereals and corn, that uses this unevenness to leave unsprayed the parts below an infestation threshold. That logic applies to in-crop control, with a selective product and the chance of a further application. It does not carry over to pre-plant burndown, for the reasons in the previous section.
In burndown, unevenness teaches something else. If the rate is set by the average condition of the field, the densest patches, with the largest plants, get less than they need. The result is escapes precisely where there are most weeds, and that is where the real loss sets in.
The question that comes before spraying is this: where is the worst part of the field, how big is it and what is in it?
A real case: 47 hectares before planting
To make this concrete, we used a field of 47.19 hectares (about 117 acres), mapped by drone before planting, still without a crop. The image was divided into 97 cells of roughly half a hectare each, and vegetation cover was measured in every one: the percentage of the area occupied by green plants.
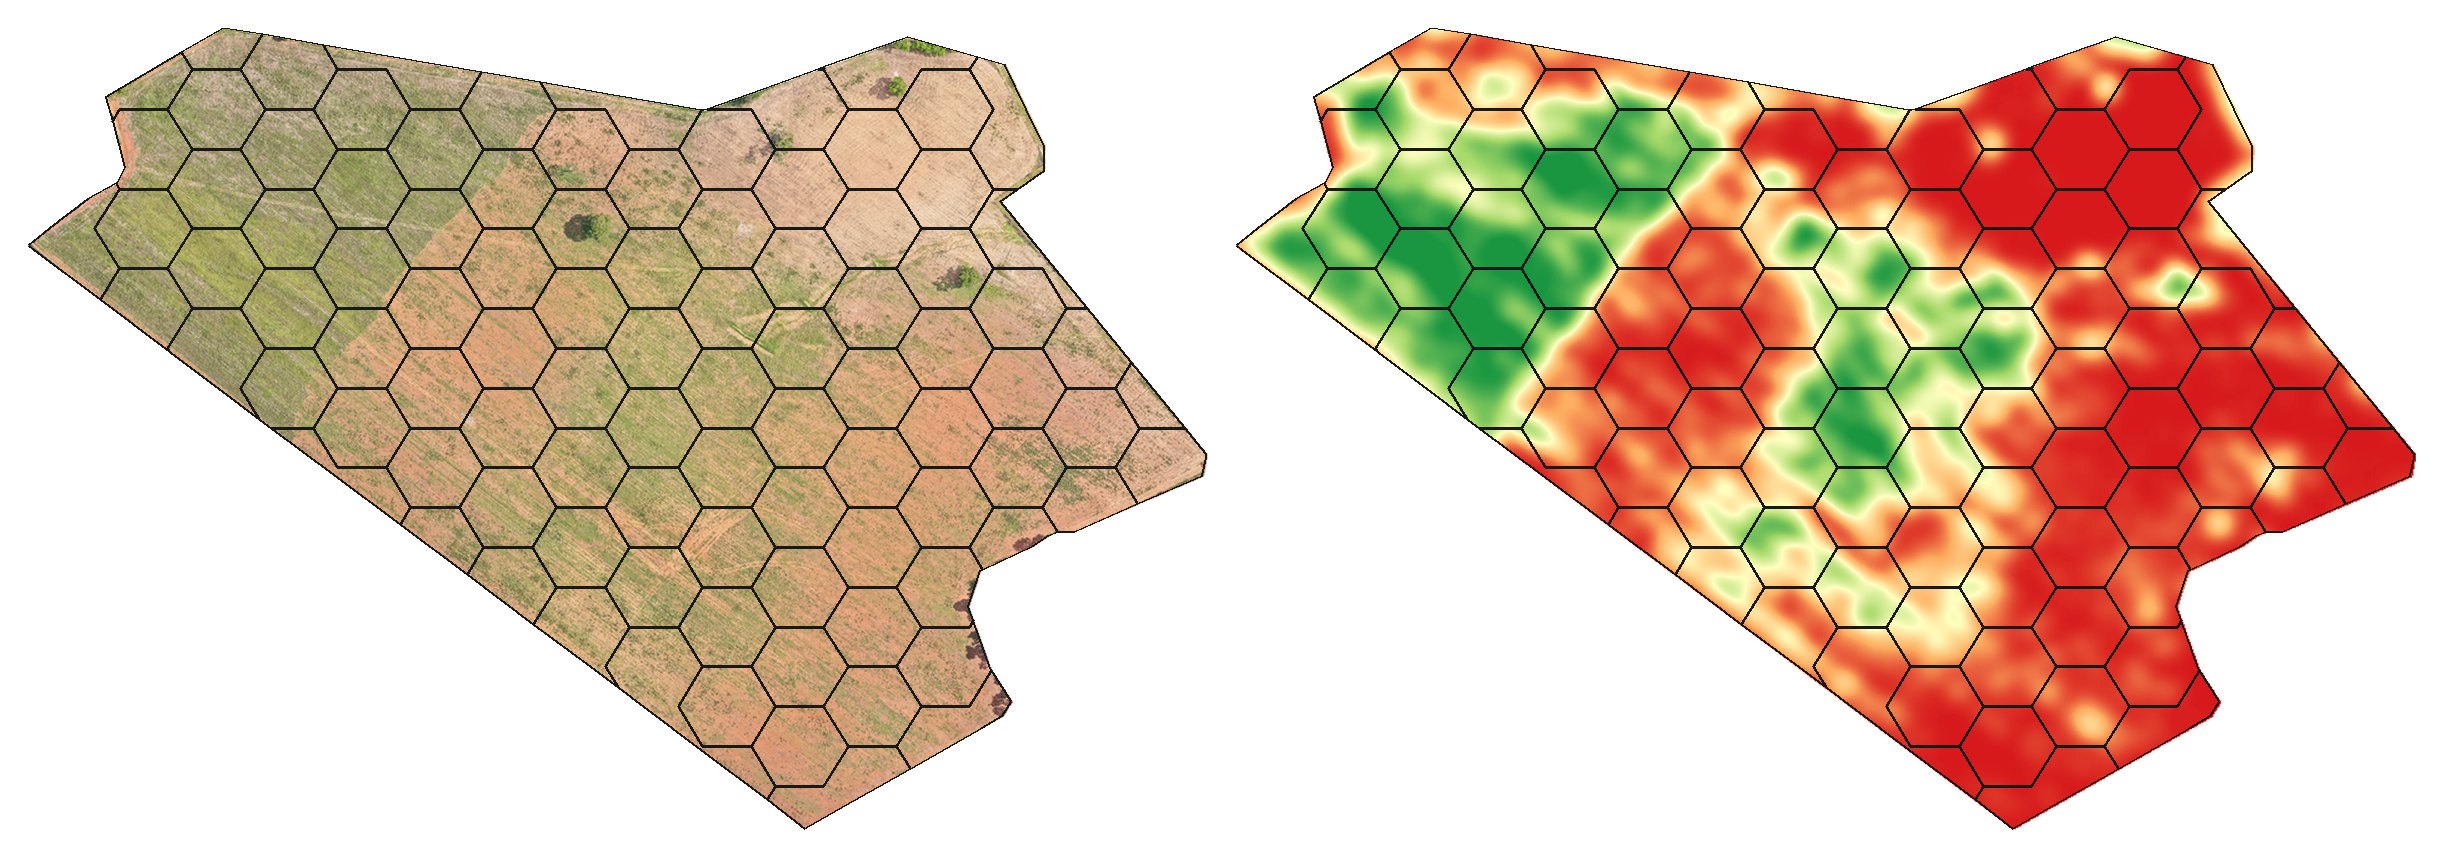
On the left is the aerial photo. On the right, the vegetation density map of the same field: green where there is more vegetation, red where there is less.
On average, 41% of the field was covered by vegetation. Anyone planning the application by that number is looking at a field that does not exist:
- 36 cells (17.8 ha, 38% of the area) had more than 50% cover, and the worst exceeded 90%. This is the part that decides the rate.
- 23 cells (11.1 ha, 24% of the area) had less than 20% cover.
- 9 cells (4.5 ha, 10% of the area) had less than 10%.
A rate planned for "41% cover" would be insufficient on almost 18 hectares. And none of these groups is left out of the application: on the cleanest hectares the plants are few, but they are there.
Flat rate: size it by the most infested part
Most growers spray at a flat rate, with no spray drone and no electronic rate controller. For them the map matters even more, because the single rate has to cope with the worst stretch.
The map shows where to go. Instead of walking at random, scouting starts at the most infested cells. That is where the agronomist identifies the species, assesses plant size and defines the product and rate able to control the hardest case in the field.
The map also gives the size of the problem. Knowing that the worst condition covers 18 hectares, and not a strip along the edge, changes the planning of spray mix, product and operation.
The result is a whole-field application, at a rate defined by the worst there is, not by what it looks like on average. That is how you make sure there will be no escapes.
Variable rate: more where needed, never zero
Those who have a spray drone or a sprayer with an electronic controller can go a step further and work with rate zones: the highest rate where weeds have closed in and plants are large, and a lower rate, still effective and within the label, where plants are few and small.
The gain lies in matching the product to the problem. The rule stays the same: every zone is sprayed. The lowest rate on the map is the one that controls the lightest condition, never the absence of a rate.
From flight to application, step by step
1. Fly. An ordinary drone with an RGB camera is enough: what you want to know is where there are green plants.
2. Process. The photos become a single image of the field, divided into cells, each with its own vegetation cover measurement.
3. Read the map. The vegetation density map shows where weeds are concentrated. The cell ranking orders the field from the most to the least vegetated.
4. Scout the worst cells. With navigation on the phone, the agronomist goes straight to the most infested points, and also checks a few of the cleanest.
5. Define product and rate. The decision belongs to the agronomist, based on the species, the growth stage and the label.
6. Spray the whole field, at a flat rate or by zones.
7. Go back to the worst cells afterwards. That is where any escape shows up first, in time to react.
What the map does not decide for you
It does not identify species. The map sees green plants. It does not tell horseweed from sourgrass, nor a weed from a cover crop. That is the job of scouting.
It does not see everything. Newly emerged seedlings and the seed bank do not appear in the image. One more reason not to treat a low-cover area as a clean area.
Product, rate and plant-back interval are a matter for the label and the prescribing agronomist. The map shows where the worst case is and how big it is. The recommendation belongs to the professional in charge.
For those who provide spraying services
Those who operate spray drones usually receive the field and the rate ready-made. An imaging flight before the application changes the conversation with the client:
- the rate is discussed with the map in hand, not from the impression of someone who walked the edge of the field;
- the client receives a report that shows where the heaviest infestation was and justifies what was applied;
- after the application, the critical areas are already marked for the escape check.
It is a service that delivers more than spraying: it delivers the assurance that the rate was sized for the worst stretch.
Conclusion
A badly sized burndown rarely fails across the whole field. It fails in the densest patches, which the average rate does not control, and that is where the cost shows up: more competition, more seeds in the soil and, at the limit, a compromised harvest.
FieldRank shows where the most infested part of the field is, how big it is and how to get there, so that the decision on product and rate is made with data, knowing exactly what the area needs. You can explore real projects, without signing up, on the demo page.
References
- Gazziero, D. L. P.; Adegas, F. S.; Voll, E. (2013). A importância do manejo de entressafra no controle de buva e capim-amargoso. In: Resumos da XXXIII Reunião de Pesquisa de Soja da Região Central do Brasil. Londrina: Embrapa Soja.
- Hamouz, P.; Hamouzová, K.; Holec, J.; Tyšer, L. (2013). Impact of site-specific weed management on herbicide savings and winter wheat yield. Plant, Soil and Environment, 59(3), 101-107.
- San Martín, C.; Andújar, D.; Barroso, J.; Fernández-Quintanilla, C.; Dorado, J. (2016). Weed decision threshold as a key factor for herbicide reductions in site-specific weed management. Weed Technology, 30, 888-897.